


25 Facts on Global Military Spending
August 23, 2009
25 Facts on Global Military Spending
August 17, 2009 · Print This Article
Last week on an airplane ride to Boston, I was reading the book Common Wealth by Jeffrey Sachs when I came across some statistics on military spending in Chapter 12, Rethinking Foreign Policy.
One statistic stood out to me from p. 274. I read that “One day’s Pentagon spending would provide enough funds to ensure antimalarial bed net protection for every sleeping child in Africa for five years.” I learned that while the Pentagon spent an average of $1.6 billion per day in 2007 only $1.5 billion in total was needed to provide nets for 300 million sleeping sites. This was interesting, and compelling.
I decided to do some additional research on global military spending, and here’s what I found. I’d love your thoughts and comments!
25 Facts on Global Military Spending
To make it on this list a statistic must be from a trusted primary source with a clear “as of” date or a reputable secondary source that clearly lists its primary sources. All statistics are sourced and cited at the bottom of the page. Please add a comment if you find additional good sources.
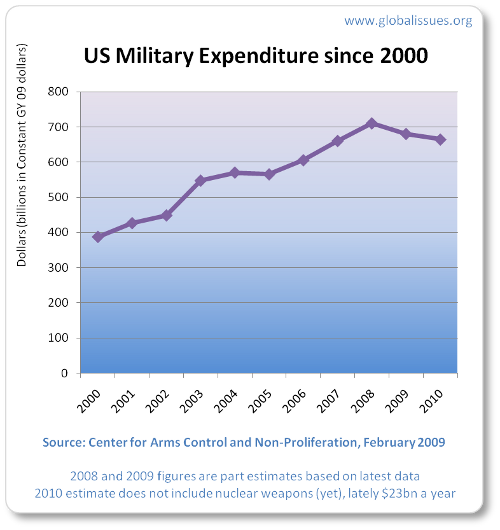
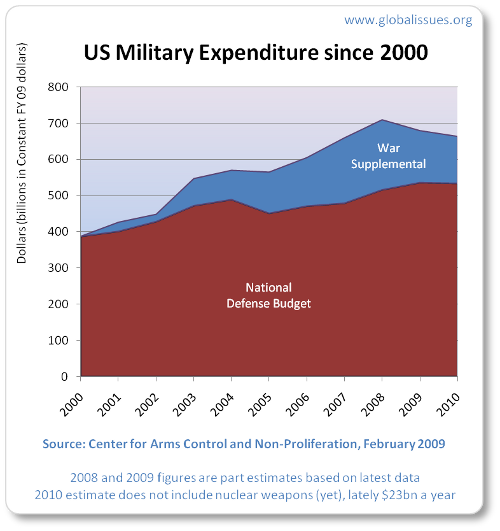
- Between 2000 and 2008, including supplemental war spending, U.S. military spending increased from 387 billion to 710 billion, an 83% increase. (1)
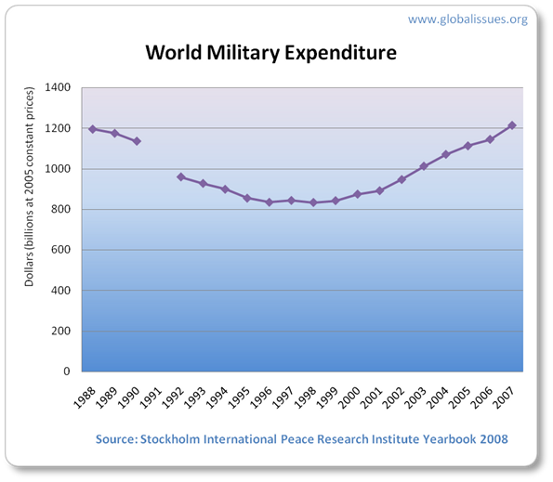
- In 2007, world military expenditure reached $1.339 trillion (2)
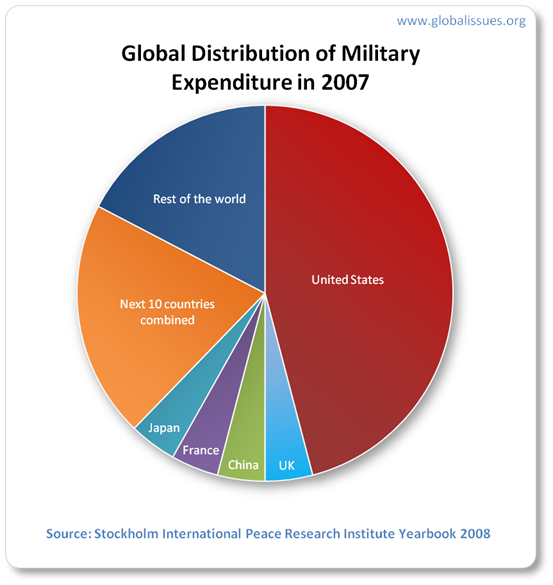
- In 2007, the USA’s military spending accounted for 45 per cent of the world total, followed by the UK, China, France and Japan. (2)
- In 2007, the 15 countries with the highest military spending account for 83 per cent of the total (2)
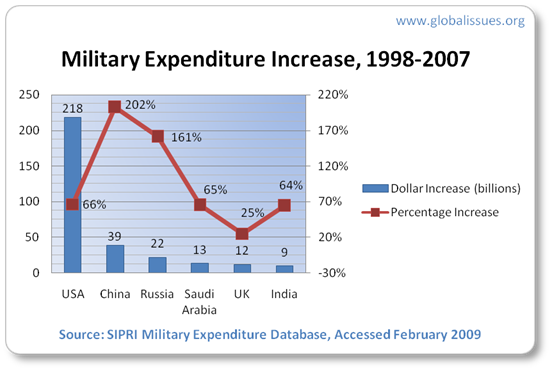
- Between 2001 and 2007 US military expenditure has increased by 59 per cent in real terms, principally because of spending on military operations in Afghanistan and Iraq and due to increases in the ‘base’ defense budget. (2)
- Global Military spending increased 45% between 1998 and 2007 (2)
- In 2007, the United Nations and all its agencies and funds spent $24.9 billion, or about $4 for each of the world’s inhabitants (2)
- In 2007, the UN’s budget was 1.86% of the world’s military expenditure (2, 3)
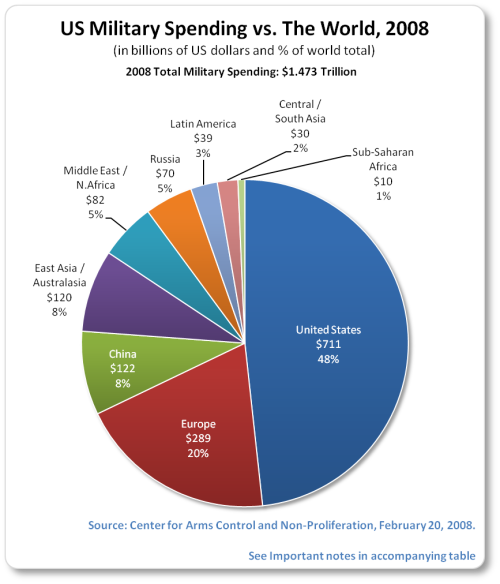
- In 2008, world military expenditure reached 1.472 trillion (4)
- In 2008, U.S. military spending was $711 billion, 48.28% of the global total, followed by China with 8.28%, Russia with 4.75%, and the UK with 3.76% (4)
- In 2008, the combined military spending of the second through eighth largest military spenders (China, Russia, the United Kingdom, France, Japan, Germany, and Italy) was $300.2 million less than the military spending of the first largest military spender, the United States (4)
- In 2008, US military spending was more than the next 46 highest spending countries in the world combined. (4)
- in 2008, US military spending was 5.8 times more than China, 10.2 times more than Russia, and 98.6 times more than Iran. (4)
- In 2008, US military spending is almost 55 times the spending on the six states of Cuba, Iran, Libya, North Korea, Sudan and Syria whose spending amounts to around $13 billion. (4)
- In 2008, the United States and its strongest allies (the NATO countries, Japan, South Korea and Australia) spend $1.1 trillion on their militaries combined, representing 72 percent of the world’s total. (4)
- In 2009, the U.S. Military base budget was $515.4 billion in 2009 plus 135.8 billion in emergency and discretionary spending for a total of $651.2 billion. (5)
- In 2006, including all military-related expenditures outside of the Department of Defense, the United States spent $934 billion on its military in 2006 (6)
- In 2007, one day of spending of the U.S. Pentagon ($1.6 billion) would equal enough funds to ensure antimalarial bed net protection for every sleeping site in Africa for five years (300 million bed nets at $5 each). (7)
- In 2007, the United States spent $572 billion on its military, $11 billion on international security, $14 billion on development and humanitarian aid, and $11 billion for diplomatic functions. (8)
- In 2009, the United States spent $710 billion in military spending (4), $18.8 billion in total bilateral economic assistance via USAID (9), and $5.2 billion in development aid to Africa (10)
- Military expenditure comprised approximately 2.4 per cent of global gross domestic product (GDP) in 2008. (11)
- The combined arms sales of the Top 100 arms-producing companies reached $347 billion, an increase of 11 per cent in nominal terms and 5 per cent in real terms over 2006. (12)
- Between 2002 and 2007 the value of the Top 100 arms sales has increased by 37 per cent in real terms. (12)
- Forty-four US companies accounted for 61 per cent of the Top 100’s arms sales in 2007, while 32 West European companies accounted for 31 per cent of the sales. (12)
- The estimated financial value of the international arms trade in 2007 was $51.1 billion. According to national data, the USA was the largest arms exporter in 2007, with exports worth $12.8 billion; Russia was in second place, with $7.4 billion; France was in third place, with $6.2 billion; Israel was in fourth place, with $4.4 billion; and the UK was in fifth place, with $4.1 billion. (13)
Additional Facts in Graphs & Images:
 |
 |
 |
 |
 |
 |
 |
 |
| Image Source: U.S. Military Spending vs. the World, Center for Arms Control and Non-Proliferation |
 |
 |
 |
| Image source: Stockholm International Peace Research Institute (SIPRI)’s 2009 Year Book, Appendix 2A |
 |
| Image source: Stockholm International Peace Research Institute (SIPRI)’s 2009 Year Book, Appendix 6A |
 |
| Image source: Stockholm International Peace Research Institute (SIPRI)’s 2009 Year Book, Appendix 6A |
 |
| Image source: Stockholm International Peace Research Institute (SIPRI)’s 2009 Year Book, Appendix 6B |
 |
| Image source: Nuclear Warheads by Country, Stockholm International Peace Research Institute (SIPRI)’s 2009 Year Book, Chapter 8 |
 |
| Image source: Nuclear Warheads by Country, Stockholm International Peace Research Institute (SIPRI)’s 2009 Year Book, Appendix 12A |
|
Fact Sources:
|
Please add comments below on any thoughts you have or additional good sources. Thank you!
25 Facts on Global Poverty
August 1, 2009
25 Facts on Global Poverty
August 16, 2009 · Print This Article
One of the challenges I’ve faced as I’ve sought to learn all I can on global poverty over the past few years has been how challenging it is to find accurate, trusted statistics on the topic. I spent a few hours tonight beginning a compilation of stats on global poverty, which I’ve added as a new page on The Humanity Campaign web site.
What do you think about these facts? What can we do to end extreme poverty in our lifetime? Please feel free to comment at the bottom of the page.
Special Thanks:
Thank you to the site GlobalIssues.org for their work in collecting verifiable facts and statistics on major global issues. Their page “Poverty Facts & Stats” was of great help in compiling these statistics. Thank you also to the World Bank, UNICEF, UNICEF Cananda, and UNDP for vital reports neccessary for the compilation of these statistics. The United Nations report “The Millennium Development Goals Report 2009” was also particularly helpful.
A Collection of Sourced & Verifiable Facts on Global Poverty
To make it on this list a statistic must be from a trusted primary source with a clear “as of” date. All statistics are sourced and cited at the bottom of the page.
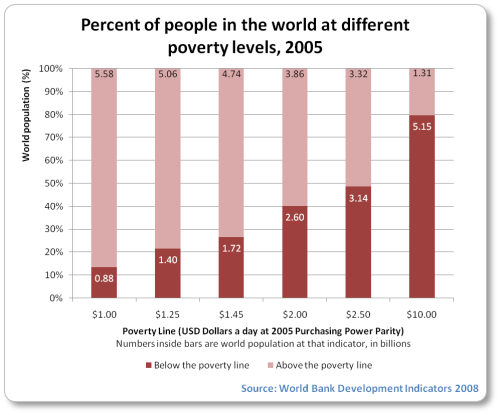
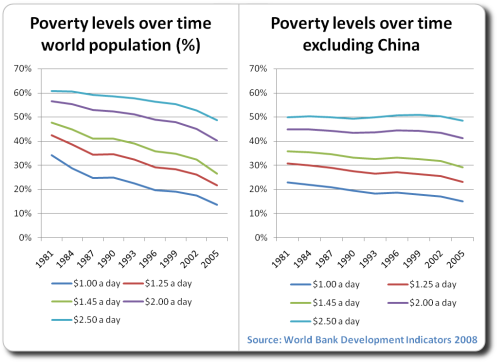
- As of 2008, 79.8% of humanity lives on less than $10 per day. (5.15 billon people) (1)
- As of 2008, 48.6% of humanity lives on less than $2.50 per day. (3.14 billion people) (1)
- As of 2008, 40.2% of humanity lives on less than $2 per day. (2.60 billion people) (1)
- As of 2008, 21.7% of humanity lives on less than $1.25 per day (1.40 billion people) (1)
- As of 2008, 13.6% of humanity lives on less than $1 per day. (880 million people) (1)
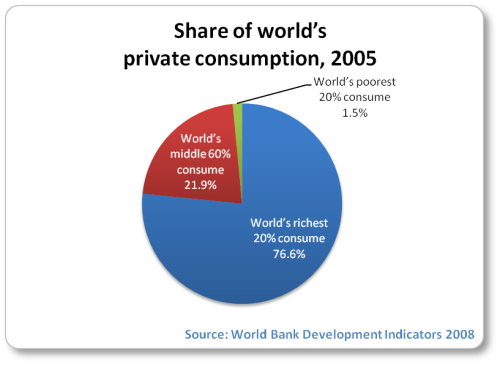
- As of 2008, the world’s richest 20% consume 76.6% of private consumption (1)
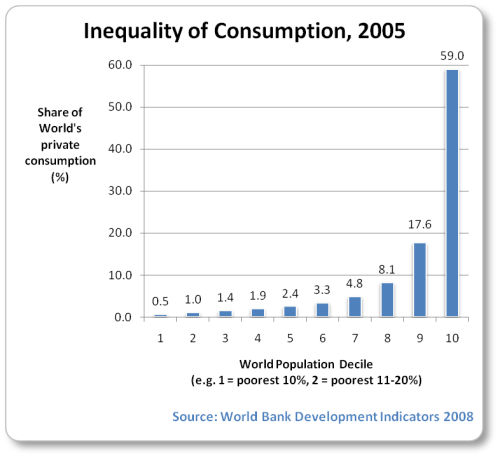
- As of 2008, the world’s richest 10% consume 59.9% of private consumption (1)
- As of 2009, 25,000 children under 5 years old die each day due to poverty (2)
- As of 2006, access to piped water into the household averages about 85% for the wealthiest 20% of the population, compared with 25% for the poorest 20%. (3)
- As of 2007, every year there are 350–500 million cases of malaria, with 1 million fatalities: Africa accounts for 90 percent of malarial deaths and African children account for over 80 percent of malaria victims worldwide. (4)
- As of 2007, 1.6 billion people — a quarter of humanity — live without electricity (5)
- As of 2007, the GDP (Gross Domestic Product) of the 41 Heavily Indebted Poor Countries (567 million people) is less than the wealth of the world’s 7 richest people combined. (6, 7, 8 )
- As of 2009, the poverty line in the USA for a single individual is drawn at $10,830 per annum or $29.67 per day. (9)
- As of 2006, 10.6 million children die every year from causes that are easily preventable – equal to 29,000 children every day (10)
- As of 2006, half of these deaths 29,000 daily deaths of children occur in just six countries – China, the Democratic Republic of the Congo, Ethiopia, India, Nigeria and Pakistan (10)
- As of 2006, 2 million children die every year from pneumonia and other acute respiratory infections, making it the leading cause of death of children under five years of age (11)
- As of 2006, 1.6 million children die every year from Diarrhoeal disease, primarily from the resulting severe dehydration that can quickly result in the failure of vital organs in young children (11)
- As of 2006, 1.1 million children die every year in Africa from malaria, making it the largest cause of death for children under five in Africa. (11)
- As of 2006, 657,000 children under the age of 15 are infected with HIV every day, most through transmission of the virus from mother to baby during pregnancy, childbirth or breastfeeding (11)
- As of 2006, 500,000 children die every year from measles. (11)
- As of 2008, on the whole, people are healthier, wealthier, and live longer today than 30 years ago. If children were still dying at 1978 rates, there would have been 16.2 million dealths of children globally in 2006. In fact there were only 9.5 million such deaths. This difference of 6.7 million deaths is equivalent to 18,329 children’s lives being saved every day. (12)
- As of 2007, each year, more than 500,000 women die from treatable or preventable complications of pregnancy and childbirth. (13)
- As of 2007, in sub-Saharan Africa, a woman’s risk of dying from complications from childbirth over the course of her lifetime is 1 in 16, compared to 1 in 3,800 in the developed world. (13)
- As of 2005, an estimated 15.2 million children had lost one or both parents to AIDS (14)
- In 2008, net disbursements of official development assistance (ODA) reached $119.8 billion. That is equivalent to 0.3 per cent of developed countries’ combined national income. (15)
Global Poverty Facts in Graphs


Source: UN Millennium Development Goals Report 2009, p. 51

Source: UN Millennium Development Goals Report 2009, p. 52
Sources:
- World Development Indicators 2008, World Bank, August 2008
- UNICEF State of the World’s Children, 2009
- 2006 United Nations Human Development Report, pp.6, 7, 35
- 2007 Human Development Report (HDR), United Nations Development Program, November 27, 2007, p.25.
- UN Millennium Development Goals Report 2007, p.44
- World Bank Key Development Data & Statistics, World Bank
- Luisa Kroll and Allison Fass, The World’s Richest People, Forbes
- World Bank’s list of Heavily Indebted Poor Countries (41 countries)
- www.hhs.gov“. The 2009 HHS Poverty Guidelines. http://aspe.hhs.gov/poverty/09poverty.shtml.
- UNICEF Canada 50 Year Progress Report 2006, Overview Sheet
- UNICEF Canada 50 Year Progress Report 2006
- World Health Organization, World Health Report 2008, p. 14
- UN Millennium Development Goals Report 2007, p.16
- UN Millennium Development Goals Report 2007, p.20
- UN Millennium Development Goals Report 2009, p. 48
Recent Comments